学习Vue的总结
通过Vue操作echarts
1.首先创建一个容器
<code class="prettyprint" ><div ref="chart" style="width: 400px; height: 400px"></div>此时创建了一个长宽都为400px的容器,且容器名为'chart'
2.导入echarts
<code class="prettyprint" >import * as echarts from "echarts"3.在钩子(methods())中定义函数
methods: {
// 引用钩子
initChart() {
// 定义函数
const my_charts = echarts.init(this.$refs.chart);
// 实例化echarts表
const option = {
title: {
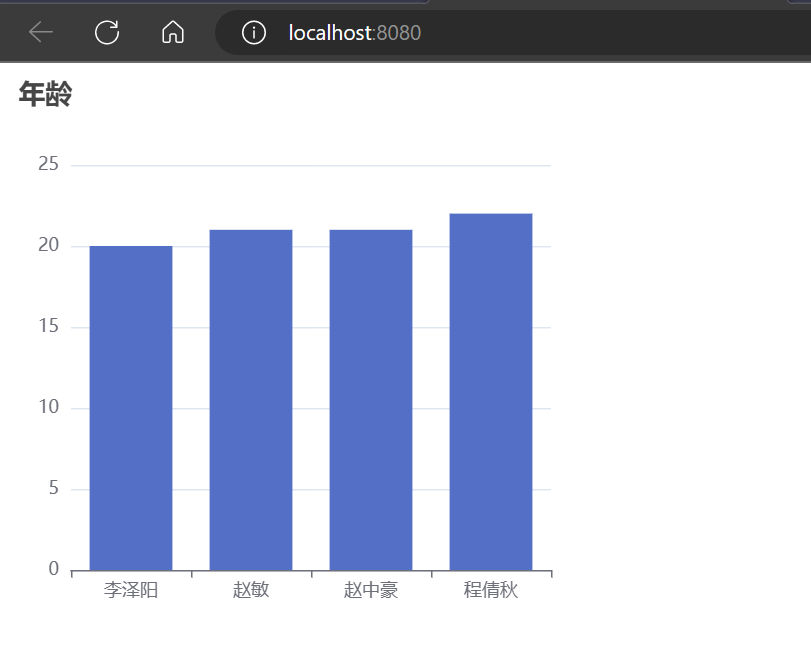
text: "年龄",
},
tooltip: {},
xAxis: {
data: ["李泽阳", "赵敏", "赵中豪", "程倩秋"],
},
yAxis: {},
series: [
{
name: "销量",
type: "bar",
data: [20, 21, 21, 22],
},
],
};
// 写入配置
my_charts.setOption(option);
// 将配置放入图表中展示
},
},在钩子中调用 函数
mounted() {
    this.initChart();
    // 调用函数
  },
完整的代码为
<template>
  <div ref="chart" style="width: 400px; height: 400px"></div>
  <!-- 创建一个长宽为400px的容器 -->
</template>

<script>
import * as echarts from "echarts";
// 导入ecarts
export default {
  methods: {
    // 引用钩子
    initChart() {
      // 定义函数
      const my_charts = echarts.init(this.$refs.chart);
      // 实例化echarts表
      const option = {
        title: {
          text: "年龄",
        },
        tooltip: {},
        xAxis: {
          data: ["李泽阳", "赵敏", "赵中豪", "程倩秋"],
        },
        yAxis: {},
        series: [
          {
            name: "销量",
            type: "bar",
            data: [20, 21, 21, 22],
          },
        ],
      };
      // 写入配置
      my_charts.setOption(option);
      // 将配置放入图表中展示
    },
  },
  mounted() {
    this.initChart();
    // 调用函数
  },
};
</script>
运行后的结果如下